
Chicagoland Home Heating & Cooling by the Numbers (2026)
Updated October 2026
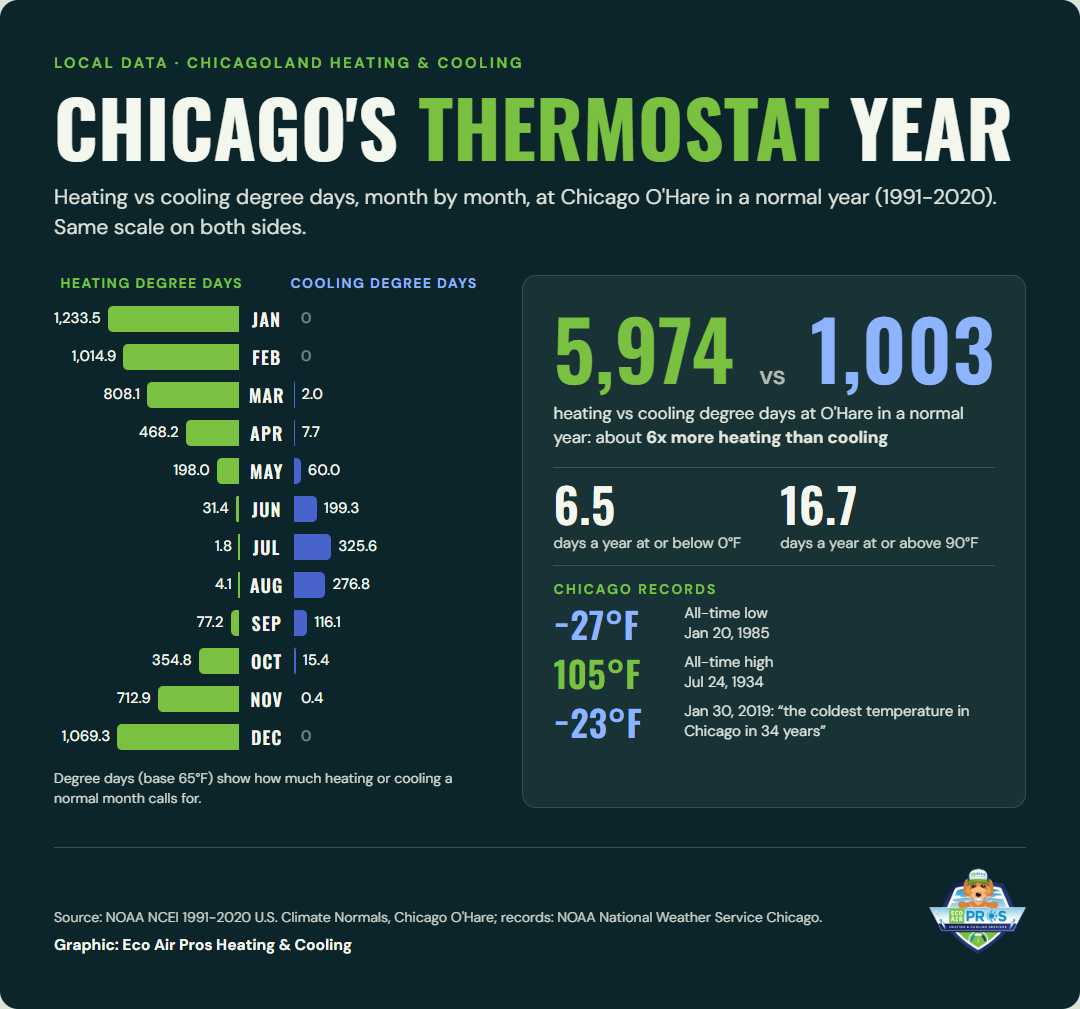
In a normal year, Chicago O’Hare logs 5,974 heating degree days and only 1,003 cooling degree days, so local homes need about six times more heating than cooling[1]. That is why gas furnaces and boilers dominate here: 80.2% of occupied homes in Cook County heat mainly with utility gas, compared with 46.5% of homes nationwide[2]. This page gathers the public numbers behind Chicagoland’s heating and cooling, from NOAA, the U.S. Census Bureau, the U.S. Energy Information Administration and the local utilities, with a source for every figure.
Key Takeaways
- O’Hare averages 6.5 days a year at or below 0°F and 16.7 days at or above 90°F (1991-2020 normals).[1]
- Chicago’s all-time record low is -27°F (January 20, 1985) and its all-time record high is 105°F (July 24, 1934).[3]
- O’Hare hit -23°F on January 30, 2019, which the National Weather Service called “the coldest temperature in Chicago in 34 years.”[4]
- The coldest morning of last winter came on January 23, 2026: -11°F at O’Hare, with a wind chill of -36°F.[5]
- The July 1995 heat wave left 465 heat-related deaths in Chicago between July 11 and 27, per the federal disaster survey report.[6]
- 78% of Illinois homes heat mainly with natural gas[7], and 11% heat with a steam or hot-water boiler, versus 8% nationally.[8]
- 91.2% of Elmwood Park’s homes were built before 1980.[9]
- About 62% of the homes in Cicero, Maywood and Riverside were built before 1940.[9]
- 54.0% of Chicago households rent their home.[10]
- Illinois homes paid 19.32 cents per kWh for electricity in August 2026, up from 18.03 cents a year earlier (+7.2%).[11]
- Peoples Gas’s gas charge for November 2026 is 35.18 cents per therm.[12]
- Space heating is 59% of household energy use in Illinois homes, versus 42% nationally.[13]

How cold, and how hot, does Chicago get?
Cold enough that heating is the main event. In a normal year, January alone racks up more heating degree days at O’Hare than the whole year’s cooling degree days (see the monthly table below)[14].
Degree days measure how far the daily average temperature falls below or rises above 65°F, which tracks how hard a furnace or air conditioner has to work. O’Hare’s normal January runs from a low of 18.8°F to a high of 31.6°F, while July’s normal high is 84.5°F[14]. Across a normal year, O’Hare sees 121.3 nights at or below freezing but only 0.3 days at or above 100°F[1]. Midway, the warmer city station, logs 5,752.8 heating degree days, 1,111.2 cooling degree days, 19.8 days at 90°F or hotter and 4.3 days at 0°F or colder[15], a gap that reflects the urban heat island.
Embed this graphic
Free to use on your site, newsletter or story. Copy the code below; please keep the credit link.
Normal monthly heating and cooling degree days at Chicago O’Hare, with Chicago’s temperature records. Data: NOAA NCEI 1991-2020 U.S. Climate Normals (station USW00094846); records from NOAA National Weather Service Chicago.
| Month | Heating degree days | Cooling degree days |
|---|---|---|
| January | 1,233.5 | 0 |
| February | 1,014.9 | 0 |
| March | 808.1 | 2.0 |
| April | 468.2 | 7.7 |
| May | 198.0 | 60.0 |
| June | 31.4 | 199.3 |
| July | 1.8 | 325.6 |
| August | 4.1 | 276.8 |
| September | 77.2 | 116.1 |
| October | 354.8 | 15.4 |
| November | 712.9 | 0.4 |
| December | 1,069.3 | 0 |
Normal monthly degree days, base 65°F, Chicago O’Hare, 1991-2020[14].
Record cold and the recent cold snaps
The longest run below zero on record lasted 100 hours, December 22-25, 1983, and the longest stretch below freezing was 43 days, from December 28, 1976 to February 8, 1977[3]. The average first fall freeze comes October 15 and the last spring freeze April 23[3]. During the 2019 cold, O’Hare’s wind chill bottomed out at -52°F and Rockford set an all-time low of -31°F[4]. In January 2025, wind chills at O’Hare stayed below zero from late January 18 until midday January 22, bottoming at -28°F on January 21[16].
Record heat
The most 90°F days in one year was 47, in 1988[3]. On July 13, 1995, O’Hare’s official 104°F tied its all-time station record from June 20, 1988, and the heat index officially reached 125°F at Midway[17]. In July 2012, O’Hare hit 103°F on both July 5 and July 6 during a run of three straight 100°F days; the NWS counts 65 days of 100°F or hotter in 140 years of Chicago records[18].
How do Chicagoland homes stay warm?
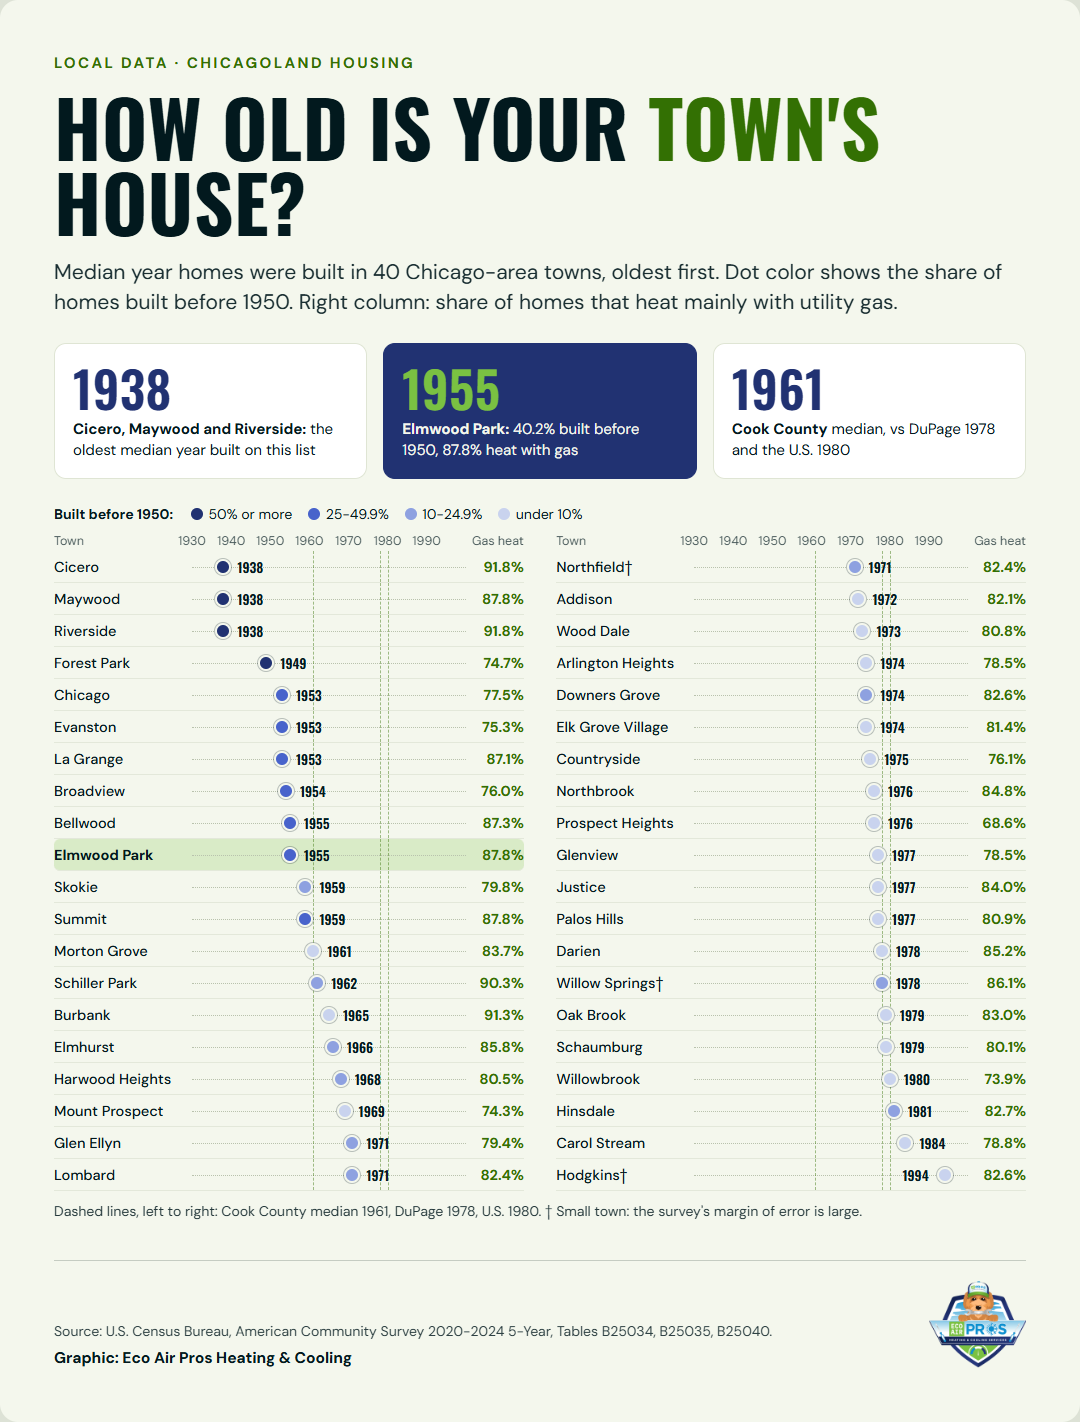
Mostly with a gas furnace. Utility gas is the main heating fuel in every one of the 40 towns in the table below, from a low of 68.6% of homes in Prospect Heights to 91.8% in Cicero and Riverside[2].
Burbank (91.3%) and Schiller Park (90.3%) round out the most gas-heavy towns. Electric heat is most common in Prospect Heights (23.8%), Forest Park (23.1%) and Mount Prospect (23.0%), still far below the 41.3% of U.S. homes that heat mainly with electricity[2]. These shares come from the Census Bureau’s 2020-2024 five-year survey, which is the only Census series that covers towns this size.
The Energy Information Administration’s separate home energy survey looks at equipment rather than fuel. In Illinois, 76% of homes use a furnace as their main heating equipment and only 2% use a central heat pump, compared with 60% and 13% nationally[8]. Illinois homes also lean on humidifiers: 43% use one, against 24% of U.S. homes, and 39% use some secondary heating equipment[8]. The same survey puts electricity at 17% and propane at 4% of Illinois main heating fuel[7]. These are statewide figures, not Chicagoland-only, and the two surveys use different methods, so their gas shares do not match exactly.
How old are the houses?
Older than most of the country. Cook County’s median home was built in 1961, against 1980 for the U.S. as a whole, and DuPage County’s median is 1978[19].
Age matters for heating because older houses are where steam and hot-water boilers, radiators, cramped chimneys and add-on ductwork show up. Riverside has the highest share of pre-1980 homes in our table, 96.5%, ahead of Cicero and Maywood at 95.2%[9]. Forest Park’s median home dates to 1949, with 47.8% built before 1940, and Evanston has 40.3% of its homes from before 1940[9]. Across the City of Chicago, 80.4% of homes predate 1980[9]. The newest stock among these towns is in Hodgkins, Carol Stream and Hinsdale, with median years of 1994, 1984 and 1981[19]. Illinois as a whole sits at 1971[19].
Embed this graphic
Free to use on your site, newsletter or story. Copy the code below; please keep the credit link.
40 Chicago-area towns ranked by the median year their homes were built, shaded by the share built before 1950, with each town’s share of homes heated mainly by gas. Data: U.S. Census Bureau, American Community Survey 2020-2024 5-Year Estimates, Tables B25034, B25035 and B25040.
| Town | Median year built | Built before 1950 | Built before 1980 | Homes heated mainly by gas |
|---|---|---|---|---|
| Cicero | 1938 | 72.3% | 95.2% | 91.8% |
| Maywood | 1938 | 68.0% | 95.2% | 87.8% |
| Riverside | 1938 | 75.2% | 96.5% | 91.8% |
| Forest Park | 1949 | 50.1% | 90.7% | 74.7% |
| Chicago | 1953 | 46.5% | 80.4% | 77.5% |
| Evanston | 1953 | 45.7% | 80.1% | 75.3% |
| La Grange | 1953 | 45.3% | 82.9% | 87.1% |
| Broadview | 1954 | 36.2% | 91.2% | 76.0% |
| Bellwood | 1955 | 27.9% | 90.0% | 87.3% |
| Elmwood Park | 1955 | 40.2% | 91.2% | 87.8% |
| Skokie | 1959 | 15.4% | 89.0% | 79.8% |
| Summit | 1959 | 29.7% | 87.2% | 87.8% |
| Morton Grove | 1961 | 6.5% | 82.2% | 83.7% |
| Schiller Park | 1962 | 12.6% | 91.0% | 90.3% |
| Burbank | 1965 | 7.7% | 84.0% | 91.3% |
| Elmhurst | 1966 | 21.0% | 69.9% | 85.8% |
| Harwood Heights | 1968 | 16.7% | 77.9% | 80.5% |
| Mount Prospect | 1969 | 5.2% | 85.7% | 74.3% |
| Glen Ellyn | 1971 | 18.4% | 78.0% | 79.4% |
| Lombard | 1971 | 12.5% | 74.7% | 82.4% |
| Northfield | 1971 | 12.0% | 78.2% | 82.4% |
| Addison | 1972 | 5.7% | 79.8% | 82.1% |
| Wood Dale | 1973 | 6.0% | 80.3% | 80.8% |
| Arlington Heights | 1974 | 6.8% | 81.6% | 78.5% |
| Downers Grove | 1974 | 11.3% | 76.8% | 82.6% |
| Elk Grove Village | 1974 | 3.3% | 87.4% | 81.4% |
| Countryside | 1975 | 7.8% | 72.8% | 76.1% |
| Northbrook | 1976 | 7.4% | 71.7% | 84.8% |
| Prospect Heights | 1976 | 5.9% | 83.2% | 68.6% |
| Glenview | 1977 | 7.0% | 64.3% | 78.5% |
| Justice | 1977 | 3.1% | 73.3% | 84.0% |
| Palos Hills | 1977 | 0.9% | 84.0% | 80.9% |
| Darien | 1978 | 1.4% | 75.1% | 85.2% |
| Willow Springs | 1978 | 12.7% | 67.2% | 86.1% |
| Oak Brook | 1979 | 3.8% | 81.7% | 83.0% |
| Schaumburg | 1979 | 1.9% | 75.5% | 80.1% |
| Willowbrook | 1980 | 1.2% | 76.3% | 73.9% |
| Hinsdale | 1981 | 18.9% | 56.6% | 82.7% |
| Carol Stream | 1984 | 2.3% | 69.8% | 78.8% |
| Hodgkins | 1994 | 2.9% | 39.7% | 82.6% |
| Cook County | 1961 | 34.4% | 80.8% | 80.2% |
| DuPage County | 1978 | 7.8% | 70.6% | 83.0% |
| Illinois | 1971 | 25.8% | 72.7% | 75.3% |
| United States | 1980 | 16.2% | 62.5% | 46.5% |
Source: U.S. Census Bureau, ACS 2020-2024 5-Year Estimates, Tables B25034, B25035 and B25040[9][19][2]. Year-built shares cover all housing units; gas-heat shares cover occupied homes. Small towns such as Hodgkins, Northfield and Willow Springs carry wide margins of error.
Who controls the thermostat: renters or owners?
In the city, renters are the majority, so the landlord usually owns the furnace or boiler. In the suburbs, owners are the majority almost everywhere.
In Elmwood Park, 34.8% of households rent[10]. The suburban towns with the highest renter shares are Forest Park (47.2%), Justice (45.7%), Cicero (45.4%) and Evanston (43.8%), while Northfield (91.8%), Oak Brook (91.1%) and Hinsdale (89.9%) are almost entirely owner-occupied[10]. Countywide, 42.3% of Cook County households rent, against 26.9% in DuPage[10].
For renters in Chicago, the city’s heat ordinance sets the floor. From September 15 to June 1, landlords must keep apartments at 68°F or warmer from 8:30 a.m. to 10:30 p.m. and at least 66°F overnight, and fines run $500 to $1,000 per day, per violation[20]. That rule covers the City of Chicago only; suburbs set their own. Town-by-town heat seasons, tenant remedies and condo rules are on our rental heat rules page.
What does heating and cooling cost here?
Electricity got more expensive over the past year. Gas supply prices this fall are lower than last fall at Nicor Gas and slightly higher at Peoples Gas. All prices below are the latest posted as of October 29, 2026, and they change monthly.
The August 2026 Illinois residential electricity price sits above the U.S. average of 18.16 cents per kWh for the same month; September data is due November 24, 2026[11]. For ComEd customers, the Price to Compare (the utility’s own supply plus transmission charge) is 10.103 cents per kWh from October 1, 2026 through May 31, 2027, made up of 8.413 cents for supply and 1.69 cents for transmission[21].
| Gas charge | Nicor Gas (most suburbs) | Peoples Gas (City of Chicago) |
|---|---|---|
| Gas supply charge, October 2026 | 33 cents/therm (39 cents in October 2025)[22] | $0.3283/therm ($0.3025 in October 2025)[23] |
| Gas supply charge, January 2026 | 42 cents/therm[24] | 41.81 cents/therm[12] |
| Monthly customer charge, residential heating | $21.30[25] | $25.81[23] |
| Distribution charge | 24.44 cents/therm (effective September 28, 2026)[25] | $0.46583/therm, plus a $0.08257/therm storage charge[23] |
Nicor Gas had not posted its November 2026 gas supply charge when we checked on October 29, 2026. Over a full year, Illinois homes paid an average of $11.25 per thousand cubic feet of gas in 2025, compared with $13.80 in 2022 and $7.94 in 2020[26]. In February 2026, a heating-season month, the Illinois residential price was $11.40[27]. Summer monthly gas prices run much higher per unit because so little gas is used, so they are a poor guide to a winter bill.
Questions about your furnace or AC? Eco Air Pros Heating & Cooling, 2303 N 77th Ct, Elmwood Park, IL 60707. Call (312) 465-8060.
Where does a home's energy go?
Into heat. Air conditioning accounts for just 5% of household energy use in Illinois homes[13], even though almost every home has it.
The average Illinois household uses 59.0 million Btu a year for space heating out of 99.3 million Btu in total[13]. Natural gas supplies 67% of household energy in Illinois homes, compared with 45% nationally, and the average Illinois home that uses gas burns 788 ccf a year, against 563 ccf across the U.S.[28]. Electricity use runs lower than the national average: 8,451 kWh a year per Illinois household versus 10,566 kWh[28].
Cooling is nearly universal. 96% of Illinois homes use air conditioning, 74% have central air (including central heat pumps) and 28% use individual units such as window, wall, portable or mini-split units; 26% also run a dehumidifier[29]. Altogether, homes accounted for 20.8% of Illinois end-use energy in 2024[30]. These figures come from EIA’s 2020 survey of Illinois homes, the most recent state-level release, and describe the state rather than the Chicago area alone.
More local data
- Chicagoland HVAC Rebates & Help by Utility and Town (2026): which utility serves each town, current ComEd, Nicor Gas and Peoples Gas rebates, and help for lower-income households.
- Furnace & AC Replacement Permits by Chicago-Area Town (2026): when a furnace or AC swap needs a permit, what it costs, and where to check a home’s permit history.
- Heat & Cooling Rules for Chicago-Area Rentals and Condos (2026): minimum heat rules, heat seasons by town, tenant remedies and condo board duties.
How we put this together
Every number on this page comes from a public source: NOAA climate normals and National Weather Service Chicago records, U.S. Census Bureau American Community Survey tables, U.S. Energy Information Administration price data and household energy surveys, Illinois Commerce Commission and utility rate filings, and the City of Chicago. Town figures use the ACS 2020-2024 five-year estimates and are not mixed with one-year estimates. Percentages in the town table were calculated from the Census table counts. Climate figures use the 1991-2020 normals for O’Hare unless another station is named. Prices and rates were checked against the publisher’s page on the date shown in each source and will be refreshed as utilities post new rates. Where two government documents disagree, we use one and name it.
Sources
- NOAA National Centers for Environmental Information, 1991-2020 U.S. Climate Normals, Annual/Seasonal, Chicago O'Hare Intl. Airport (USW00094846), https://www.ncei.noaa.gov/data/normals-annualseasonal/1991-2020/access/USW00094846.csv, checked Oct 29, 2026.
- U.S. Census Bureau, American Community Survey 2020-2024 5-Year Estimates, Table B25040: House Heating Fuel, https://data.census.gov/table/ACSDT5Y2024.B25040?g=160XX00US1723724, checked Oct 29, 2026.
- NOAA National Weather Service Chicago, Chicago, IL Temperature Records, https://www.weather.gov/lot/Chicago_Temperature_Records, checked Oct 29, 2026.
- NOAA National Weather Service Chicago, January 30-31, 2019: Record to Near-Record Cold, https://www.weather.gov/lot/RecordColdJan2019, checked Oct 29, 2026.
- NOAA National Weather Service Chicago, January 23-24, 2026: Bitterly Cold Temperatures and Wind Chills, https://www.weather.gov/lot/2026_01_23-24_Cold, checked Oct 29, 2026.
- NOAA National Weather Service, Natural Disaster Survey Report: July 1995 Heat Wave (December 1995), https://www.weather.gov/media/publications/assessments/heat95.pdf, checked Oct 29, 2026.
- U.S. Energy Information Administration, 2020 Residential Energy Consumption Survey: Highlights for space heating fuel in U.S. homes by state, https://www.eia.gov/consumption/residential/data/2020/state/pdf/State%20Space%20Heating%20Fuels.pdf, checked Oct 29, 2026.
- U.S. Energy Information Administration, 2020 Residential Energy Consumption Survey: Highlights for space heating in U.S. homes by state, https://www.eia.gov/consumption/residential/data/2020/state/pdf/State%20Space%20Heating.pdf, checked Oct 29, 2026.
- U.S. Census Bureau, American Community Survey 2020-2024 5-Year Estimates, Table B25034: Year Structure Built, https://data.census.gov/table/ACSDT5Y2024.B25034?g=160XX00US1723724, checked Oct 29, 2026.
- U.S. Census Bureau, American Community Survey 2020-2024 5-Year Estimates, Table B25003: Tenure, https://data.census.gov/table/ACSDT5Y2024.B25003?g=160XX00US1714000, checked Oct 29, 2026.
- U.S. Energy Information Administration, Electric Power Monthly, Table 5.6.A: Average Price of Electricity to Ultimate Customers by End-Use Sector, by State (August 2026 data, released Oct 23, 2026), https://www.eia.gov/electricity/monthly/epm_table_grapher.php?t=epmt_5_6_a, checked Oct 29, 2026.
- Peoples Gas, History of Gas Charges, https://www.peoplesgasdelivery.com/company/tariffs/info_hist.pdf, checked Oct 29, 2026.
- U.S. Energy Information Administration, 2020 Residential Energy Consumption Survey, Table CE3.1.ST: Annual household site end-use consumption by state, https://www.eia.gov/consumption/residential/data/2020/state/pdf/ce3.1.st.pdf, checked Oct 29, 2026.
- NOAA National Centers for Environmental Information, 1991-2020 U.S. Climate Normals, Monthly, Chicago O'Hare Intl. Airport (USW00094846), https://www.ncei.noaa.gov/data/normals-monthly/1991-2020/access/USW00094846.csv, checked Oct 29, 2026.
- NOAA National Centers for Environmental Information, 1991-2020 U.S. Climate Normals, Annual/Seasonal, Chicago Midway Airport (USW00014819), https://www.ncei.noaa.gov/data/normals-annualseasonal/1991-2020/access/USW00014819.csv, checked Oct 29, 2026.
- NOAA National Weather Service Chicago, January 19-24, 2025: Multiday Cold Spell, https://www.weather.gov/lot/2025_01_19-24_ColdSpell, checked Oct 29, 2026.
- NOAA National Weather Service Chicago, A Meteorological Diagnosis of the Chicago Killer Heat Event of July 13, 1995, https://www.weather.gov/lot/1995Jul13_heat, checked Oct 29, 2026.
- NOAA National Weather Service Chicago, July 4-7, 2012 Heat Wave, https://www.weather.gov/lot/2012July_heat, checked Oct 29, 2026.
- U.S. Census Bureau, American Community Survey 2020-2024 5-Year Estimates, Table B25035: Median Year Structure Built, https://data.census.gov/table/ACSDT5Y2024.B25035?g=160XX00US1723724, checked Oct 29, 2026.
- City of Chicago, Department of Buildings, Chicago Heat Ordinance, https://www.chicago.gov/city/en/depts/bldgs/supp_info/chicago-heat-ordinance.html, checked Oct 29, 2026.
- Illinois Commerce Commission (Plug In Illinois), Price to Compare: ComEd, https://plugin.illinois.gov/understanding-the-price-to-compare/price-to-compare-comed.html, checked Oct 29, 2026.
- Nicor Gas, Pricing & Rate Plans: Current Cost of Gas, https://www.nicorgas.com/residential/pricing-rate-plans.html, checked Oct 29, 2026.
- Peoples Gas, Natural Gas Rates, https://www.peoplesgasdelivery.com/payment-bill/gas-rates, checked Oct 29, 2026.
- Nicor Gas, Rider 6 History: Gas Supply Cost Factors, https://www.nicorgas.com/content/dam/southern-co-gas/nicor-gas/docs/rates-and-riders/nicor-rider-6-history.pdf, checked Oct 29, 2026.
- Nicor Gas, Rate 1: Residential Service (Ill. C.C. tariff, effective Sept 28, 2026, ICC Docket 26-0592), https://www.nicorgas.com/content/dam/southern-co-gas/nicor-gas/docs/rates-and-riders/nicor-rate-1.pdf, checked Oct 29, 2026.
- U.S. Energy Information Administration, Natural Gas Prices, Illinois, Annual, https://www.eia.gov/dnav/ng/ng_pri_sum_dcu_SIL_a.htm, checked Oct 29, 2026.
- U.S. Energy Information Administration, Natural Gas Prices, Illinois, Monthly, https://www.eia.gov/dnav/ng/ng_pri_sum_dcu_SIL_m.htm, checked Oct 29, 2026.
- U.S. Energy Information Administration, 2020 Residential Energy Consumption Survey, Table CE2.1.ST: Annual household site fuel consumption by state, https://www.eia.gov/consumption/residential/data/2020/state/pdf/ce2.1.st.pdf, checked Oct 29, 2026.
- U.S. Energy Information Administration, 2020 Residential Energy Consumption Survey: Highlights for air conditioning in U.S. homes by state, https://www.eia.gov/consumption/residential/data/2020/state/pdf/State%20Air%20Conditioning.pdf, checked Oct 29, 2026.
- U.S. Energy Information Administration, Illinois State Profile and Energy Estimates: Overview, https://www.eia.gov/states/IL/overview, checked Oct 29, 2026.
Glossary
- ACS: American Community Survey, the U.S. Census Bureau’s ongoing household survey.
- Btu: British thermal unit, a standard measure of energy.
- ccf / Mcf: one hundred / one thousand cubic feet of natural gas.
- Cooling degree days (CDD): how far each day’s average temperature rises above 65°F, added up over a month or year.
- EIA: U.S. Energy Information Administration.
- Heating degree days (HDD): how far each day’s average temperature falls below 65°F, added up over a month or year.
- NCEI / NOAA / NWS: National Centers for Environmental Information, National Oceanic and Atmospheric Administration, National Weather Service.
- Price to Compare: the utility’s own electricity supply and transmission price, used to compare offers from other suppliers.
- RECS: EIA’s Residential Energy Consumption Survey.
- Therm: a unit of gas energy equal to 100,000 Btu.
Get in Touch with Eco Air Pros Today
Ready to enhance your comfort? Contact Eco Air Pros Heating and Cooling your top tier HVAC Contractor at (312) 465-8060 or email help@ecoairpros.net for expert HVAC solutions tailored to your needs.
(312) 465-8060